

Announced 22 Oct 2026 · Sources checked
What Google DeepMind released
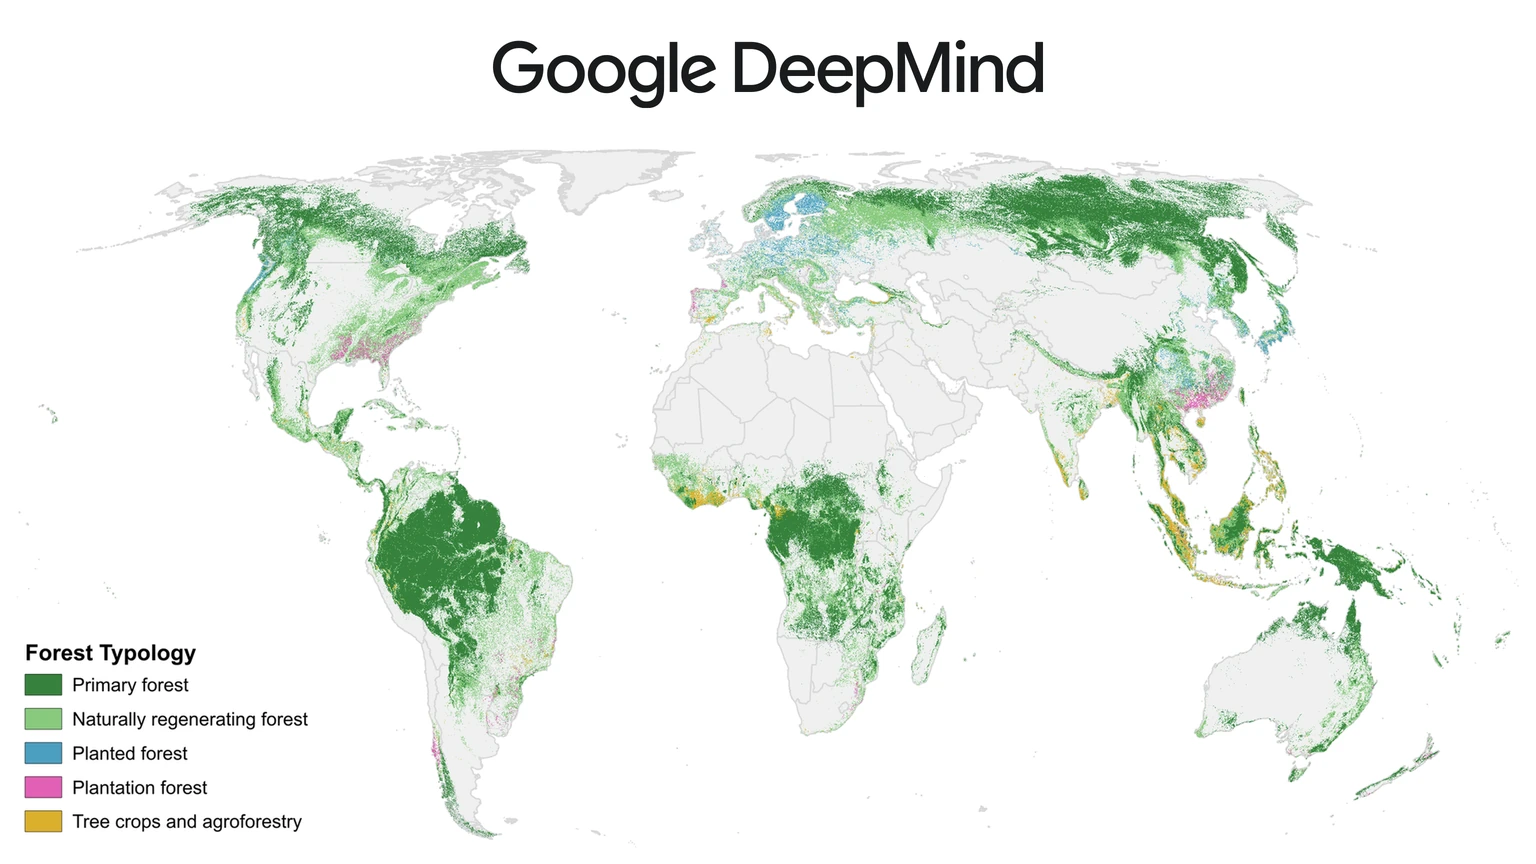
Google DeepMind and Google Research released Forest Typology, or ForTy, 2020 on 22 October 2026, a global map that sorts every 10-by-10-metre patch of land into one of six forest and land-use types. The work was done with the World Resources Institute and the International Institute for Applied Systems Analysis, and the method is described in a Scientific Data paper published on 21 October.
Alongside the 2020 map, the team shared an early time series that applies a similar approach to every year from 2017 to 2025. Google DeepMind says that for the first time, users can see at 10-metre detail worldwide, year by year, not just where forest was lost but what replaced it: a timber plantation, a tree-crop farm or other land.
The map is free on Google Earth Engine under a CC BY 4.0 licence, and Google says it is now part of Google Earth AI, its collection of geospatial models and datasets.
Why tree cover is not enough
Most global forest maps answer one question: are there trees here? That is not enough for many real decisions. From a satellite, an old-growth rainforest, a eucalyptus plantation and an oil palm estate can all look like the same patch of green, yet they hold very different amounts of carbon and support very different numbers of species.
The paper puts the stakes plainly. Forests cover about 31 percent of the world's land and store roughly 662 gigatonnes of carbon, and primary forests differ from plantations and tree crops by orders of magnitude in carbon density and species richness. Without a map of forest types, monitoring falls back on binary tree cover and cannot say what kind of forest is being lost or gained.
Regulation is the most immediate driver. The EU's regulation on deforestation-free products, known as EUDR, says goods such as coffee, cocoa and palm oil must not come from land that was forest in 2020 and was later turned into farmland. Wood products face a further test: they cannot come from primary forest that was later converted into plantations. Companies and regulators therefore need to know what kind of forest stood on a plot in 2020, not just whether trees were present. Google calls ForTy a key baseline for that rule.
ForTy builds on Natural Forests of the World 2020, a map the same group released in November 2025 that split natural forest from all other tree cover. ForTy goes further by naming the type of forest and, with the time series, tracking how it changes.
How ForTy tells forests apart
The six classes follow definitions from the UN Food and Agriculture Organization: primary forest with no visible signs of human disturbance; naturally regenerating forest that grew back on its own; planted forest managed over long cycles; plantation forest, meaning fast-growing, intensively managed tree farms; tree crops and agroforestry such as oil palm, rubber, cocoa and fruit; and other land, from grassland and cities to water.
The hard part is that several of these classes depend on how land is used, not only on how it looks. To teach the difference, the team assembled about 1.7 million labelled locations from expert surveys, national and regional datasets and targeted reviews of places where the model struggled. The paper describes a cascade of three deep learning models, each trained on labels refined by the previous stage, combining weakly supervised learning with active learning.
The key input is AlphaEarth Foundations embeddings, compact summaries of years of satellite observations for each 10-metre pixel. That lets the model pick up subtle clues such as planting patterns, growth cycles and harvest rhythms. It is the same kind of input that Ai2 released this week for free with OlmoEarth v1.3, a sign of how quickly satellite embeddings are becoming the base layer for environmental mapping.
Instead of a single yes-or-no label, ForTy publishes a score for every class at every pixel. The data catalogue explains that the five forest and tree-crop scores are stored as numbers from 0 to 250, and the score for other land is what remains. A company checking deforestation risk can accept only pixels the model is very sure about, while a researcher estimating total forest area can use the full range.
How accurate the map is
The team checked the map against a stratified random sample of 9,100 sites worldwide. At each site, two trained experts studied high-resolution imagery and years of Landsat and Sentinel records, and disagreements were settled in consensus meetings. At the time of writing, 8,190 sites had been fully resolved and were used to score the map.
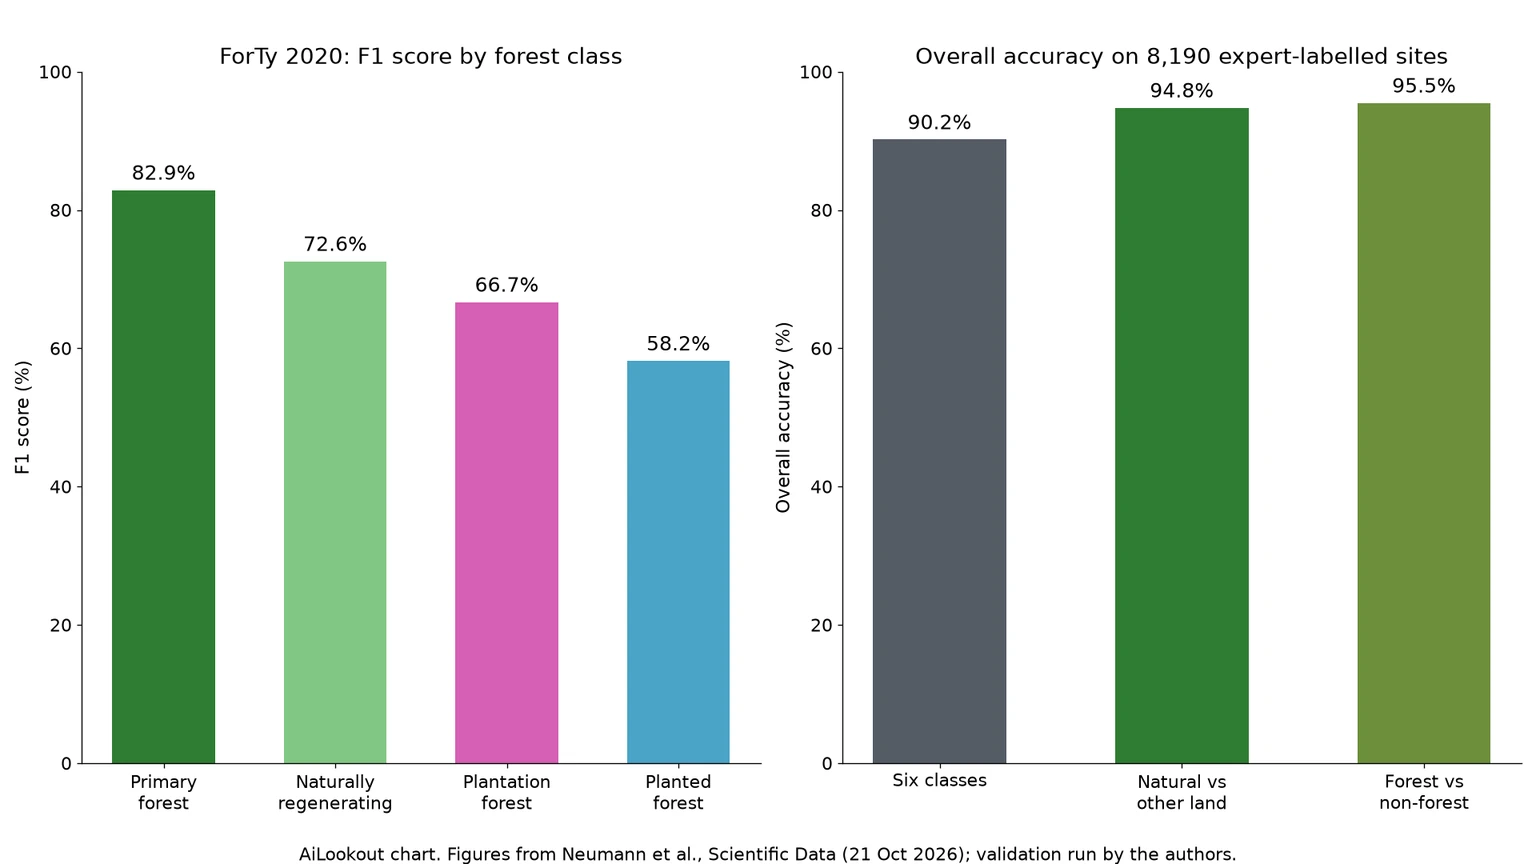
On those sites, the paper reports an overall accuracy of 90.2 percent for the six-class scheme, 94.8 percent for telling natural forest from everything else, and 95.5 percent for forest versus non-forest. Google DeepMind's blog rounds these to 90 and 95 percent and describes the sample as more than 9,000 sites, which counts the sites still awaiting consensus.
The per-class numbers are more revealing. Primary forest reaches an F1 score of 82.9 percent, naturally regenerating forest 72.6 percent, plantation forest 66.7 percent and planted forest 58.2 percent. The authors warn that because the other-land class dominates the area weighting, headline accuracy is flattered by it, and users should look at the class scores that matter to them.
Against other public products on the same validation set, the paper says ForTy had the highest forest versus non-forest accuracy and beat the European Commission's Global Forest Types 2020 map by 3.1 percentage points on a comparable four-class scheme. Those comparisons were run by the map's own authors.
Where it still struggles
The Earth Engine catalogue lists the limits openly. FAO categories rely on management intent and history, which cannot be seen from orbit, so the model infers them from proxies. Mature secondary forest can be indistinguishable from undisturbed primary forest, and shaded cocoa or coffee grown under a native canopy can still be mistaken for natural forest in some regions.
The split between planted and plantation forest uses a 40-year rotation period as a stand-in for the real EUDR criteria. Primary forest is mapped conservatively near roads and settlements, which pushes forest edges into the regrowth class. Recently harvested plantations can show up as other land because the 2020 map uses one year of observations, and the EUDR's other wooded land category is folded into other land.
The scores are averages from an ensemble of five models and have not been calibrated after training, so the authors say they should be read as relative confidence, not true probabilities. Anyone using ForTy for a regulatory decision will still need local checks.
Getting the data
The 2020 map is in the Earth Engine data catalogue as a Nature Trace publisher dataset, backed by Cloud Optimized GeoTIFFs on Google Cloud Storage, and anyone can browse it in a public Earth Engine app. The paper says the training and evaluation code is public, and the validation set of 9,100 sites is released on Figshare under CC BY 4.0.
For people who would rather ask questions than write code, Google has been folding such layers into Google Earth AI, where a Gemini-based agent can reason over geospatial data. ForTy is now listed as part of that collection.
What to watch
Google DeepMind says it will keep improving the 2017 to 2025 time series with partners and users over the coming months, so the yearly change layer should be treated as an early release. The bigger test is adoption: whether companies preparing EUDR due diligence, certification bodies and national forest agencies start citing ForTy alongside the European Commission's own maps, and whether independent groups confirm its accuracy in regions where the paper's sample is thin, such as Australia.
Common questions
What is Google's ForTy map?
Forest Typology 2020 is a global 10-metre map from Google DeepMind, Google Research, WRI and IIASA that labels land as primary forest, naturally regenerating forest, planted forest, plantation forest, tree crops and agroforestry, or other land.
Is the ForTy map free to use?
Yes. It is available on Google Earth Engine and as Cloud Optimized GeoTIFFs under a CC BY 4.0 licence, which allows reuse with credit.
Can ForTy prove EUDR compliance on its own?
No. Google calls it a baseline for the EU deforestation rule, but the authors list known confusions, such as shaded cocoa and planted forest, and say its scores are uncalibrated, so local checks are still needed.
Sources & further reading
How this story was made
Written by Kristian Kostov with AI assistance and checked against the linked sources. Company performance claims are attributed to the company. Analysis reflects AiLookout’s interpretation; we have not independently tested the products discussed. Cover photography is illustrative and does not depict the specific announcement or product.
Our editorial standards